US Regulatory System
Role: Research, Information Architecture, Information Design
Team: Jennifer Dopazo Doris Yee, Donny Chou
----------------------------
Launch Interactive Info-graphic
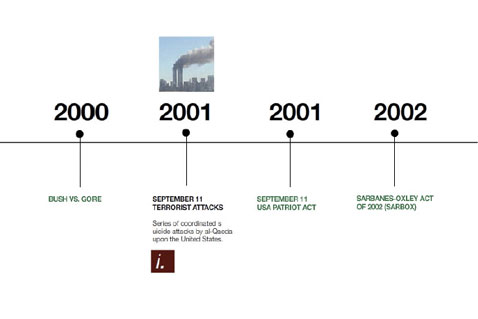
The info-graphic maps the three interconnected pillars of the US Regulatory System from 1933 to 2007.
News items in black represent external events, red items represent internal events, green items represent legislative reactions to those events, and orange items represent legislations that pertain to foreign nationals.
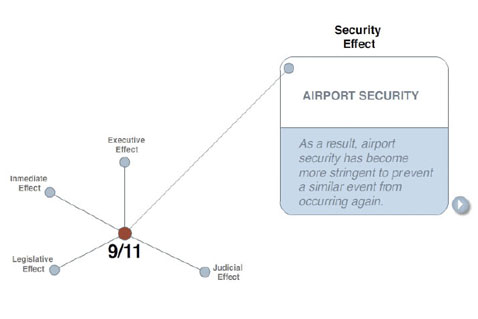
On exploring the September attacks of 2001, a viewer can browse all regulatory reactions to the event simultaneously.
Date: 2008
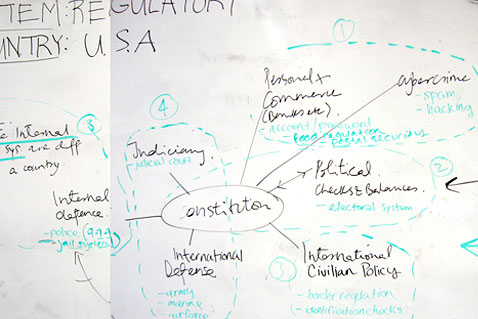
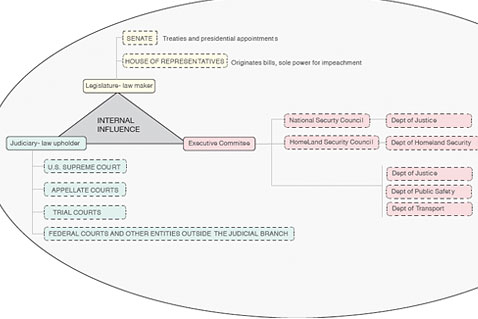
Left: Brainstorming the aspects of the Regulatory System | Right: The 'Trias Politica' of the United States.
Below: Screens from the interactive info-graphic