
I provided information architecture support for Avenues The World School, that provides K-12 education worldwide.
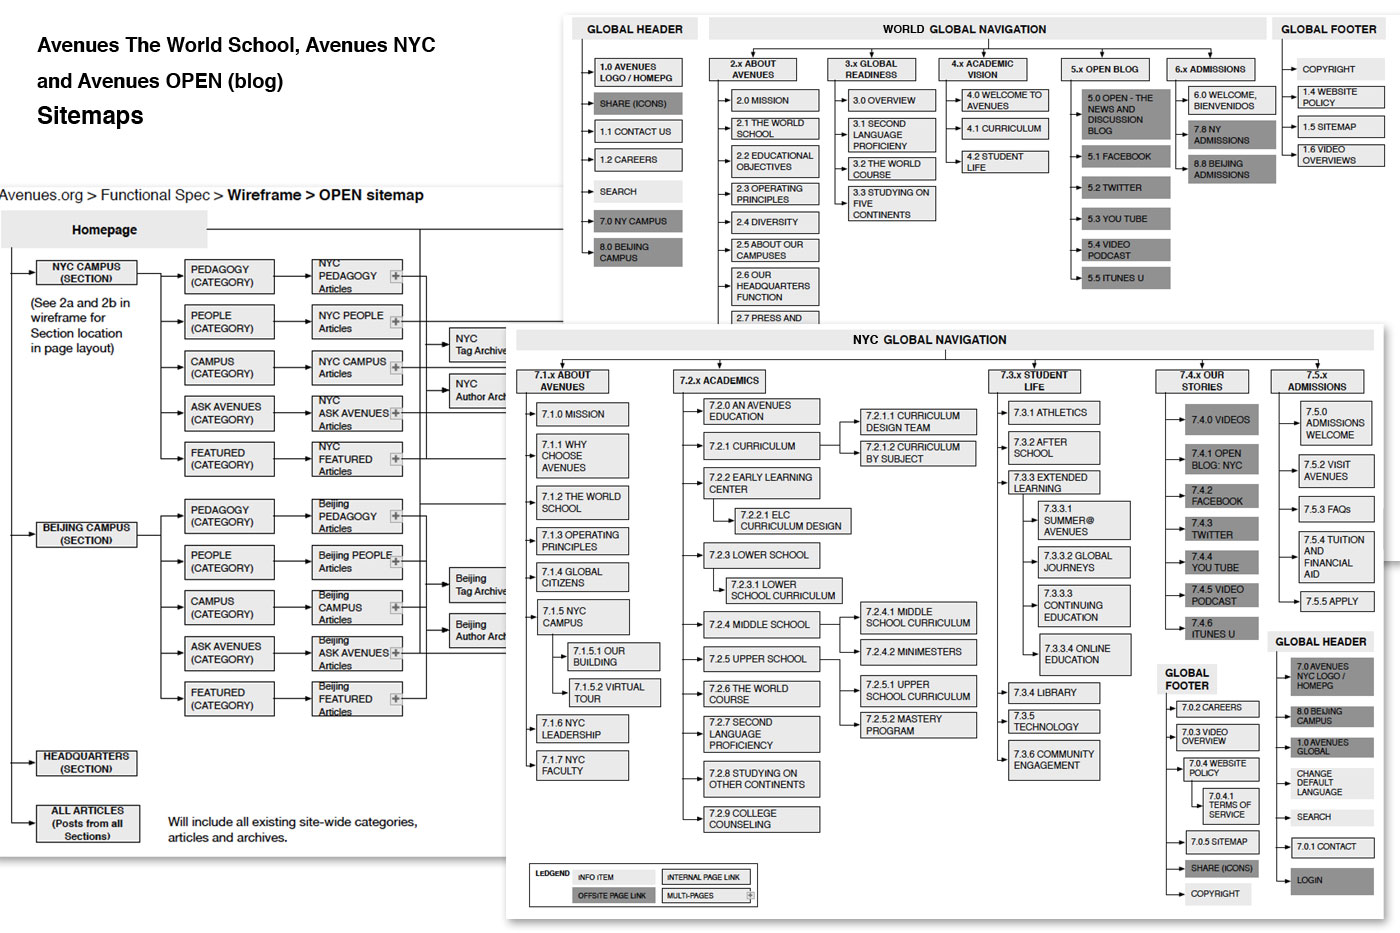
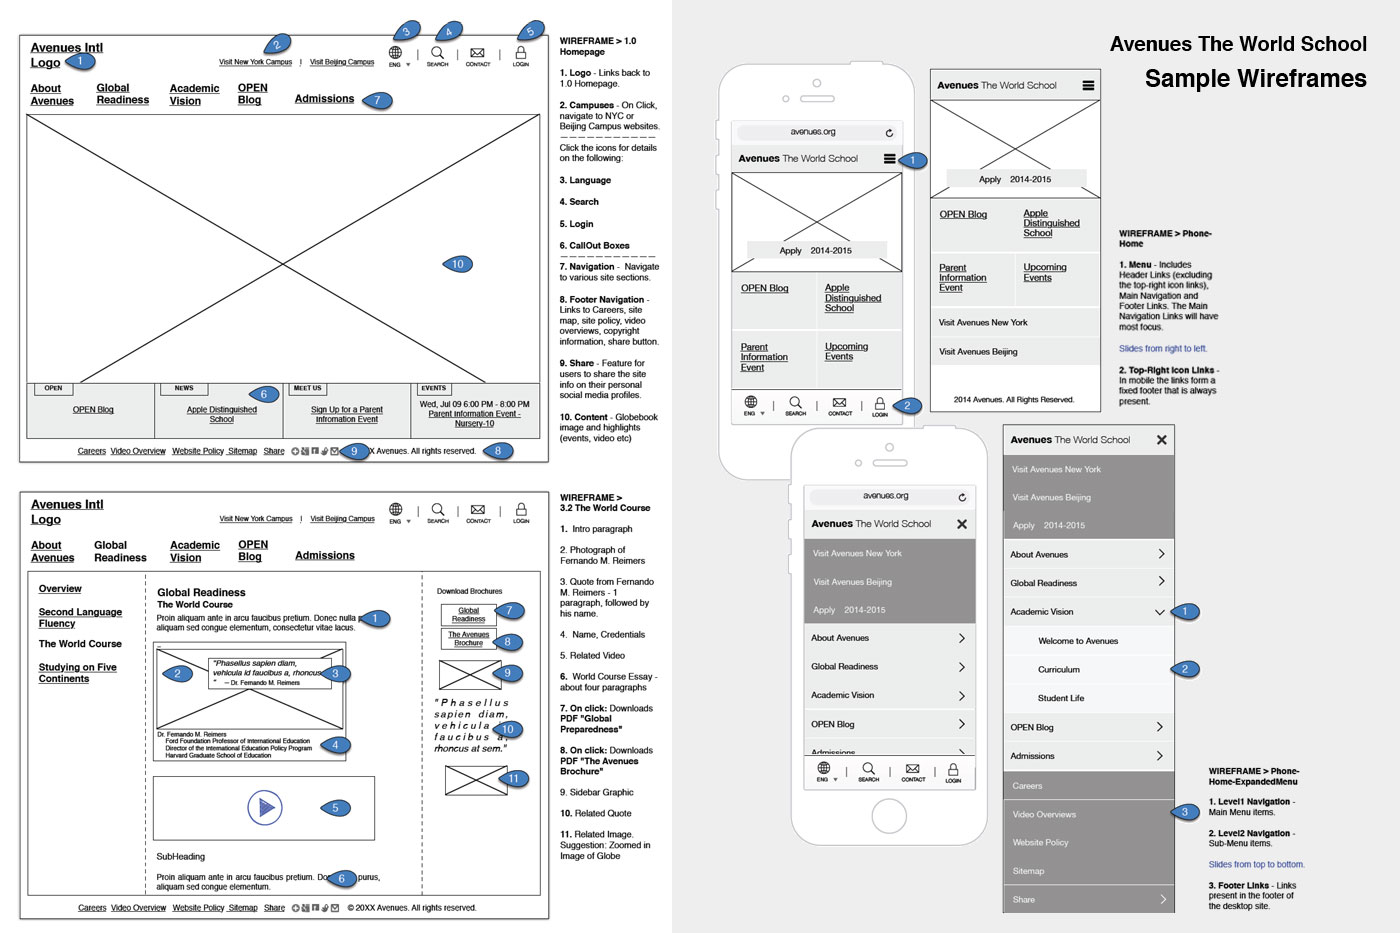
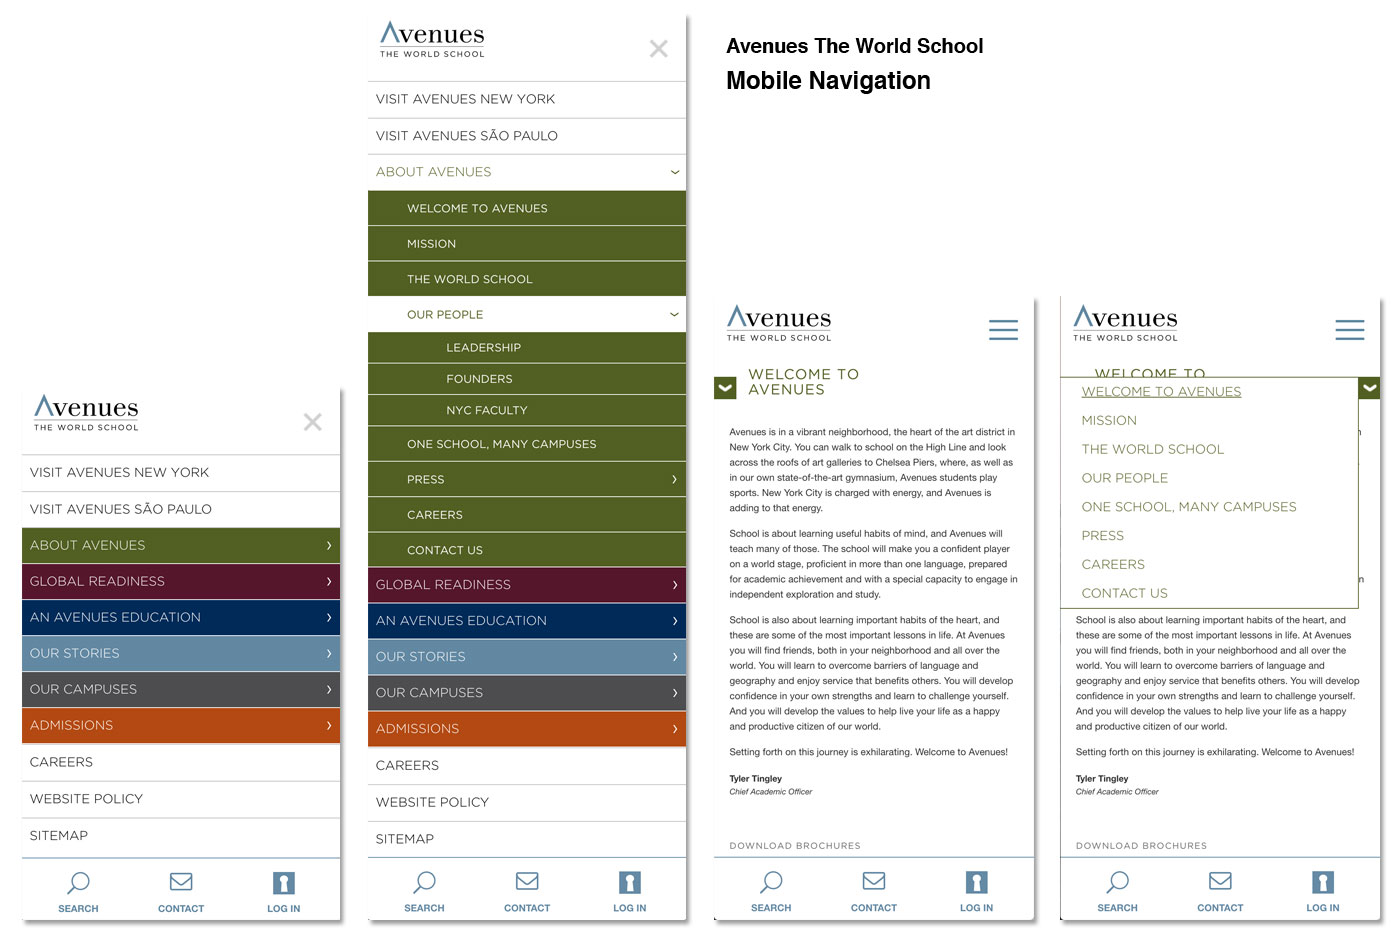
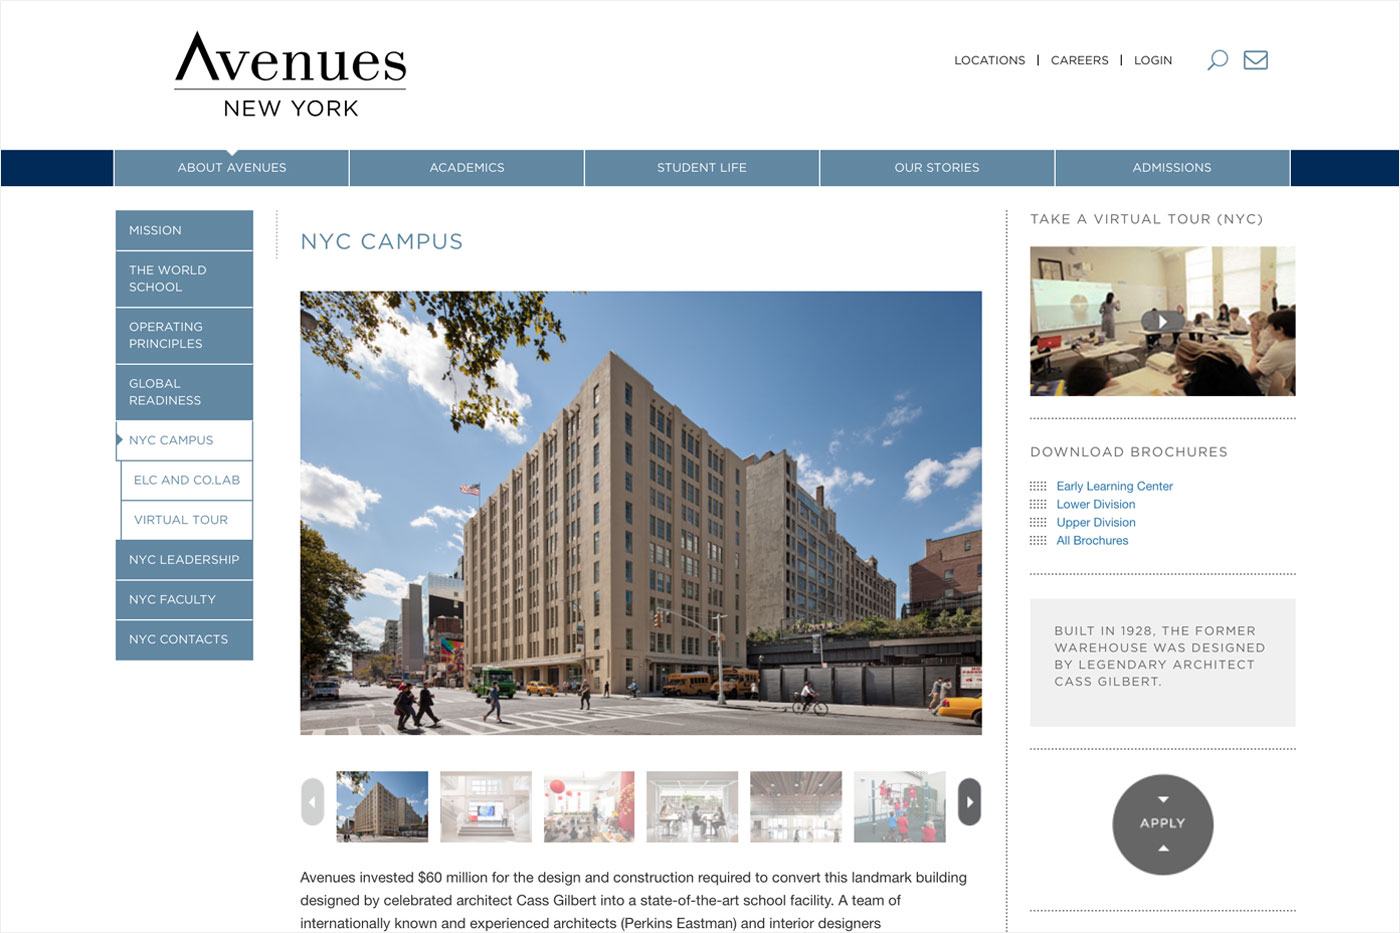
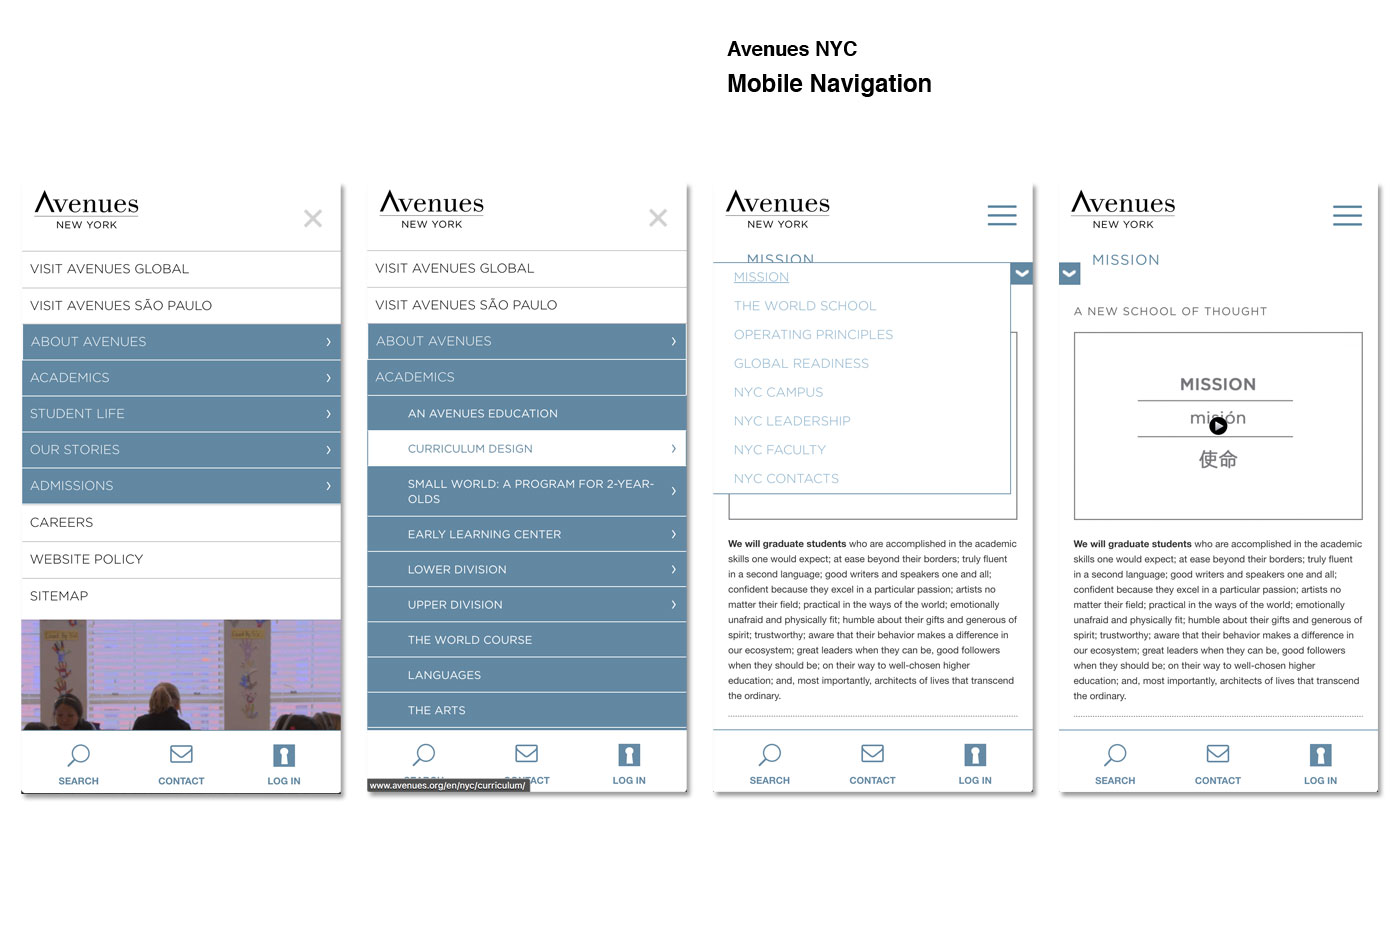
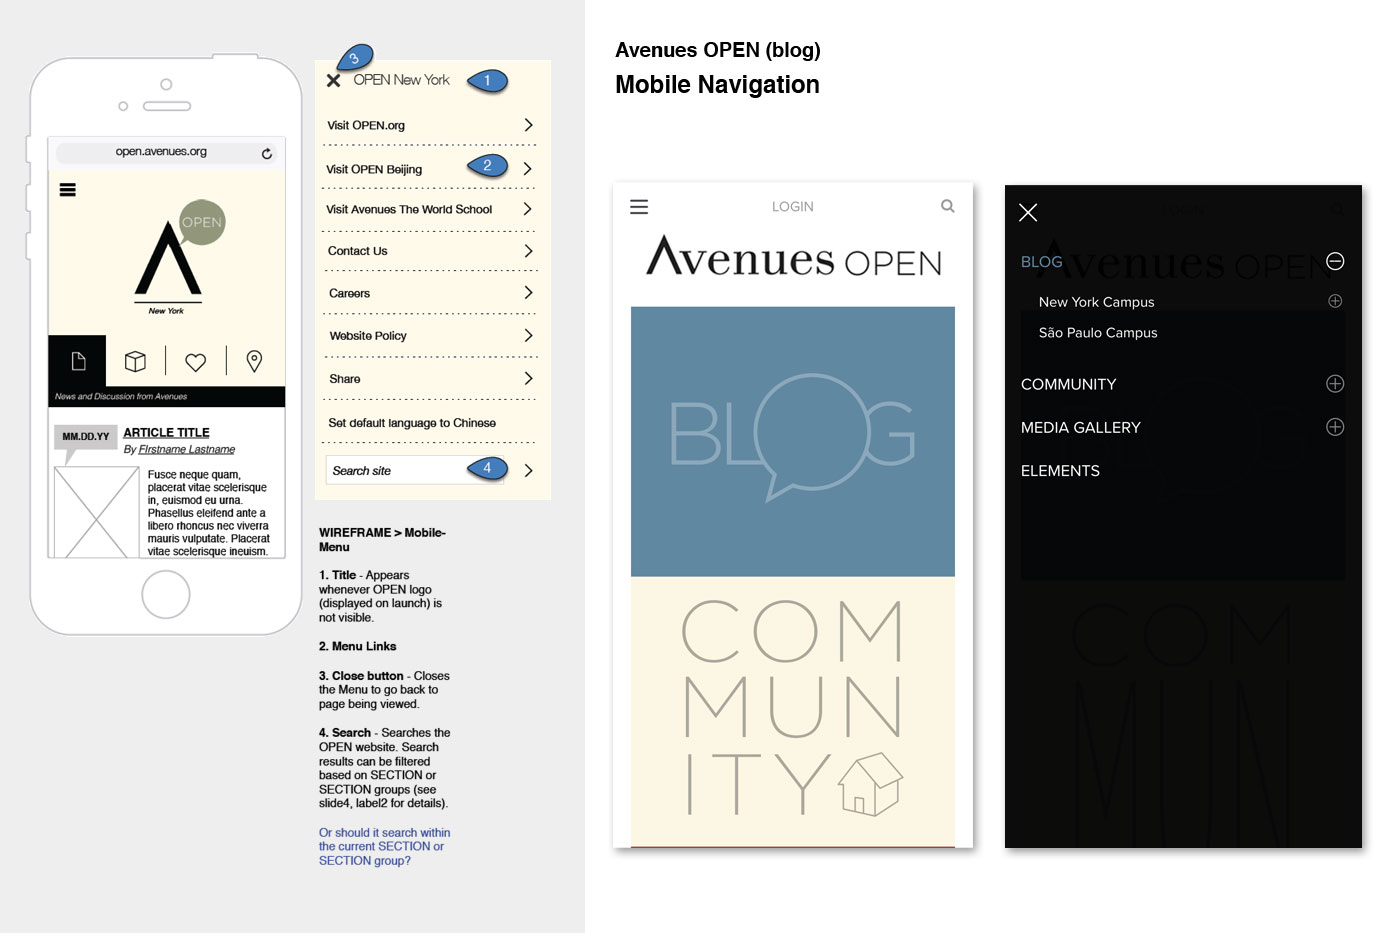
We integrated multiple campuses within a single brand and deployed it for web and mobile. The design is extensible and can handle additional campus expansions.
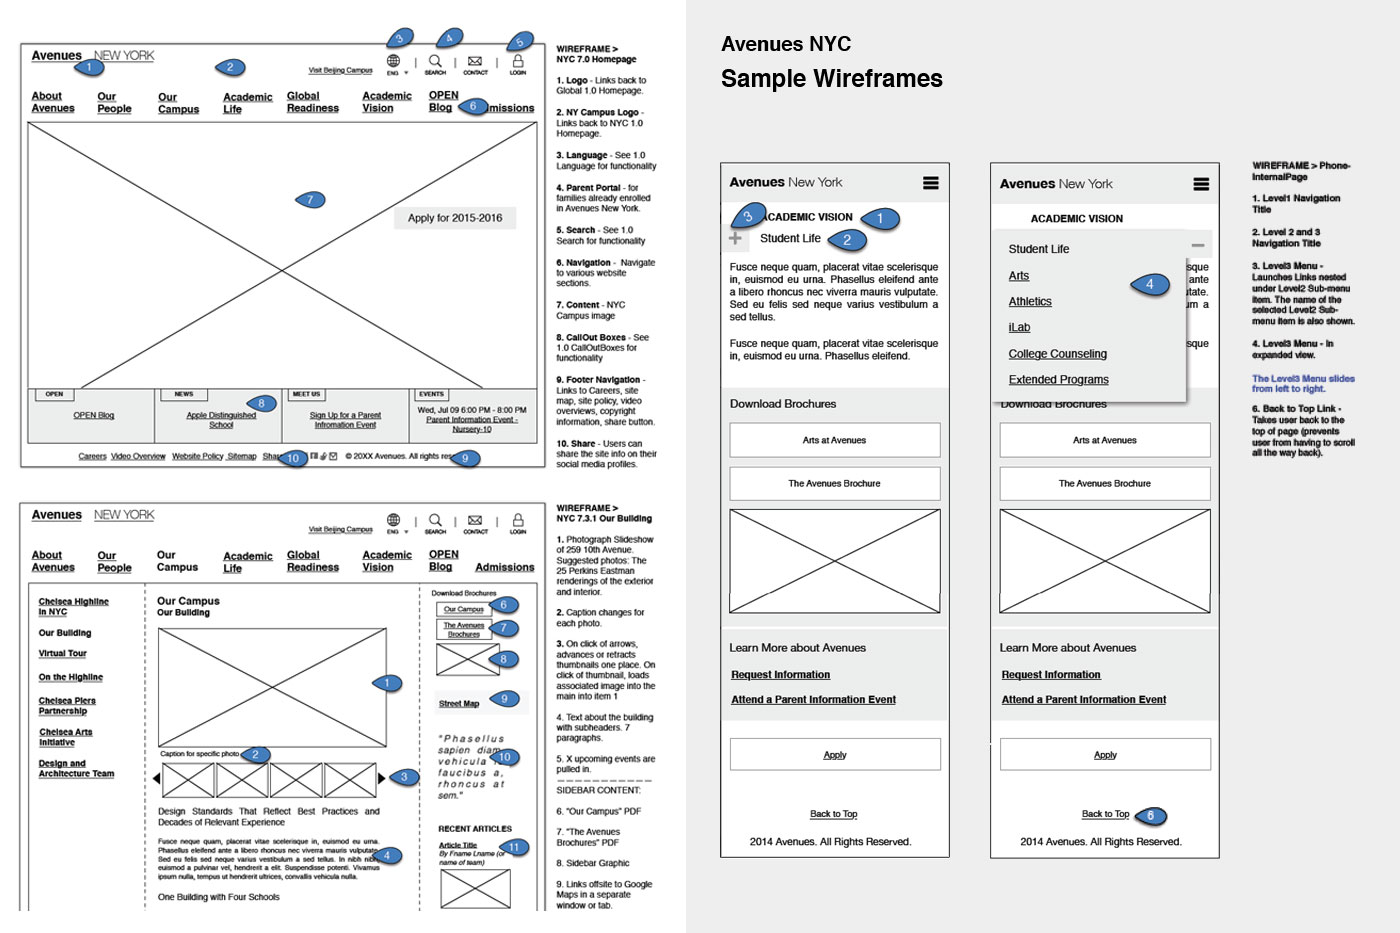
The sitemaps and wireframes were created with Omnigraffle.
Client: Early Adopter
Year: 2015
Skills: Information Architecture